Electromagnetic Compliance: Pre-Compliance Conducted Emissions Testing
October 19, 2017
Electromagnetic compliance (EMC) testing involves measuring the radio frequency (RF) output of a product and comparing the results to published limits that are set forth by a government agency responsible for creating and enforcing standards, such as the Federal Communications Committee (FCC) in the United States. Any product that has the ability to generate RF signals and is slated for commercial use is subject to meeting these requirements.
Compliance testing uses equipment and measurement techniques that are specialized, which can be cost prohibitive for most traditional companies to support. Therefore, most companies will fully develop a product and then perform testing at a third-party lab at the end of the development cycle. Unfortunately, many designs do not pass compliance testing on the first pass. Before the product can be released for sale, the EMC problems need to be fixed and the product has to be re-tested. This adds cost and can delay product introduction which can be add significant losses for a company.
Fortunately, there are simple tools and techniques that can help minimize the time spent in the EMC lab. Pre-compliance testing techniques involve performing a number of experiments that can identify and solve problem areas of you design without the burden of expensive test equipment and setups.
In this application note, we are going to introduce pre-compliance test techniques for measuring conducted emissions. These techniques can save you time and money by minimizing re-tests as well as helping you build confidence in your understanding of the electromagnetic profile of your designs. This knowledge can be used to “design for EMC” in your future products.
NOTE: Pre-compliance tests are designed to help identify and resolve issues that may hinder passing full compliance tests. Pre-compliance testing is not a replacement for full compliance testing at a certified lab!
CONDUCTED EMISSIONS
Conducted emissions testing involves measuring the RF energy that originates in the product and propagates along any interconnecting cables, such as power, signal, or data. Most standards focus on measuring the energy on Mains AC power lines. This is important because excessive RF on cables can cause excessive interference, especially with AM radio and other broadcast bands.
Conducted emissions testing requires a spectrum analyzer (figure 1), two bonded metal plates that function as ground planes, and a Line-Impedance-Stabilization-Network (LISN). The LISN supplies power to the device-under-test (DUT) and diverts the RF from the DUT to the spectrum analyzer, where it can be measured. Additional transient protection and attenuation can be added to help minimize the risk of damage to the sensitive RF input of the analyzer. A typical conducted emissions setup is shown in figure 2.
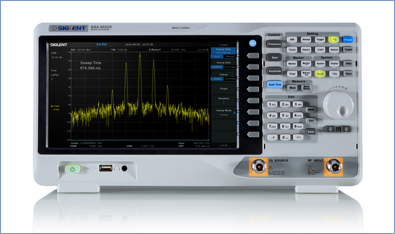
Figure 1: A SIGLENT SSX3021X 2.1 GHz spectrum analyzer.
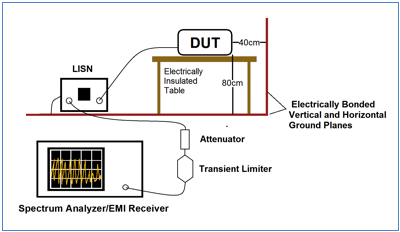
Figure 2: Typical conducted emissions compliance configuration. A transient limiter and attenuator are recommended to protect the input of the analyzer.
The cost for emulating a fully compliant conducted emissions test setup is relatively low and the setup is fairly impervious to environmental RF. This makes correlating pre-compliance data to expected compliance performance significantly easier than with radiated emissions.
EQUIPMENT LIST
Spectrum Analyzer/EMI Receiver: Measures RF power with respect to frequency. The analyzer should have a maximum frequency of at least 1 GHz, DANL of -100dBm (-40 dBuV) or less, and a minimum RBW of at least 10 kHz.
Transient Limiter (Optional): Limits potential damage to sensitive RF input of analyzer
Attenuator (Optional): Have a few 3 dB and 10 dB attenuators on-hand to help protect the RF input of the analyzer from unexpected high power signals.
LISN: Diverts conducted radiation from DUT to spectrum analyzer/EMI receiver. Select a LISN that matches the test standards and electrical requirements for your DUT.
WARNING! Read your LISN owner’s manual thoroughly. Some designs can have potentially hazardous voltages present and may require special instructions for safe operation.
Horizontal Ground plane: Conductive metal sheet sized approximately 15 cm (7”) wider than the outer perimeter of the DUT plus 40 cm (15”) in length to accommodate the spacing from the DUT to the vertical ground plane.
Vertical Ground plane: Conductive metal sheet sized approximately 15 cm (7”) wider than the outer perimeter of the DUT plus 80 cm (30”) in length to accommodate the spacing from the DUT to Horizontal ground plane. The ground planes should be electrically bonded to one another using a low impedance connection like conductive tape along the butt joint where the two planes meet.
LISN Bonding tab: Short metal conductive sheet to electrically bond/ground LISN to horizontal ground plane. A low impedance, perhaps a thin metal strap, would be preferred. Wire is not ideal.
Non-conductive table: Slightly larger than DUT. Can be wood, fiberglass, plastic. Not metal.
PHYSICAL SETUP
- Place the DUT in the center of a non-conductive table
- Place the horizontal ground plane 80 cm (30”) and center just below the DUT
- Place the vertical ground plane 40 cm (15”) behind and centered with the DUT. Electrically bond to the horizontal ground plane
- Electrically bond the LISN to the horizontal ground plane using the LISN bonding strap
- Place the spectrum analyzer/EMI receiver a few feet from the edge of the horizontal ground plane/test area and connect it to a power source
BACKGROUND CHECK
- Warm up the analyzer per the manufacturers recommendations
- Power on the LISN, but do not connect the DUT at this time
- Connect the LISN RF output to the RF Input of the analyzer, including the transient limiter and a 3 or 10 dB external attenuator
- Configure the analyzer
- Set the start frequency to 150 kHz
- Set the stop frequency to 30 MHz
- Set the RBW to 1 MHz
- Set the detector to Positive Peak
- Enter the LISN correction data into the analyzer and enable the corrections function to ensure the accuracy of the measurements
- Many analyzers have provisions for creating of limit lines. If available, you can add the specific limit line of interest to the analyzer. This eases evaluation by visibly showing the limit that you are testing to.
- (Optional) If you are using a transient limiter, enter it’s correction data into the analyzer and enable the corrections function to ensure the accuracy of the measurements
- (Optional) If you are using an external attenuator, enter it’s correction data into the analyzer and enable the corrections function to ensure the accuracy of the measurements
- (Optional) Many EMC standards limits are defined in the units dBuV vs. Log frequency. Most analyzers allow you to set the units to dBuV and the horizontal scale to logarithmic on the display.
- With no input connections, observe the trace on the analyzer. It should be smooth and very low in power. You can also lower the RBW to 10 kHz or the closest setting to it. These scans represent the open port noise floor of the instrument.
It is worthwhile to save these as a picture or image file to reference later. Figure 3 below shows an open port spectragraph of a SIGLENT SSA3032X spectrum analyzer configured as suggested above:
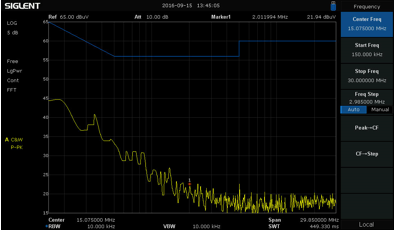
Figure 3: Open port noise floor of an SSA3032X spectrum analyzer. Note the dBuV amplitude units, log frequency scaling, and blue limit line. These features make scan evaluation more convenient.
FIRST SCAN
- Disconnect the LISN output from the analyzer input
- Connect the power cord from the DUT to the LISN. Do not coil the power cable. Make sure it lies flat and does not run between the DUT and the horizontal ground plane.
- Power on the DUT
- Re-connect the LISN RF Output to the Spectrum Analyzer RF input.NOTE: These steps add another layer of protection to the sensitive analyzer front-end. Some LISNs include features that can minimize these transients and in such cases, these steps can be considered optional.
- Observe the scan and note any peaks that are within 3dB or exceed the limit line. These are potential problem areas.NOTE: It is a good idea to capture a copy of the display either using a camera or a screen capture/print along with details notes of the experimental setup, instrument settings, and any DUT information.
Figure 4 below shows a peak scan with failures.
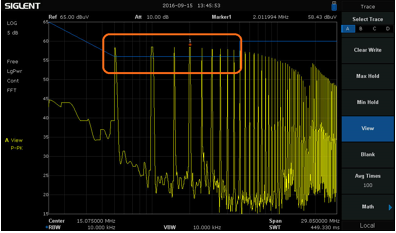
Figure 4: A preliminary scan showing peaks that exceed the Class B limits for conducted emissions, per the FCC subpart 15 for unintentional radiators.
SUCCESSIVE SCANS AND EVALUATION
The preliminary scan described above will provide a good indication of potential fault frequencies. But, the settings are not identical to those indicated in most specifications. We suggested that the following analyzer settings: RBW = 10kHz, Detector = Positive Peak, Span = 30MHz. This allows you to perform quick analysis of problematic areas and quickly gain a basic idea of the conducted emission performance of the DUT.
Here are optional techniques that can help provide more insight:
1. Most spectrum analyzers do not have pre-selection filters. If you are using a spectrum analyzer without pre-selection filters, the peaks you observe may not be real. Analyzers without pre-selection filters can create false peaks due to out-of-band signals mixing with the observed signals.
You can test the validity of a peak by adding an external attenuator (3 or 10dB should do). Real peaks will fall by the amount of the attenuator. If the peak falls by more than the attenuator, it is likely to be a false peak. Make a note of the false peaks for comparison with your compliance test results. You can also use pre-selection filters or an EMI receiver, but these tend to be cost prohibitive for most quick testing.
Figure 5 below shows a typical peak confirmation test. The yellow trace was collected without an attenuator. The Pink trace was collected with a 10 dB attenuator added to the RF input of the analyzer. In this case, the peaks drop the same amount as the added attenuation. This helps affirm that the peaks are likely real and not products of out-of-band signals.
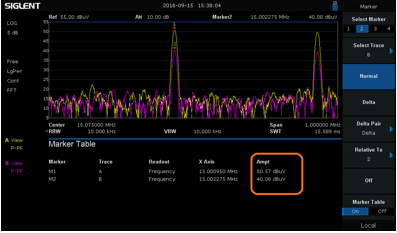
Figure 5: Comparison of two scans using the marker table function of the SIGLENT SSA3000X spectrum analyzer. The Yellow trace was collected without attenuation while the Pink trace was collected after adding a 10 dB external attenuator.
2. Some analyzers have toolkits that more closely match the performance of true compliance receivers.
These toolkits are usually unlocked instrument options that include:
- EMI filter (6 dB shoulder vs. standard 3 dB standard IF frequency shape)
- RBW bandwidths of 200 Hz, 9 kHz, and 120 kHz
- Quasi-Peak (QP) detector
If you expect that the DUT has bursts of RF, intermittent digital communication, or transient outputs, it may be worthwhile to re-run a scan using the EMI filter, RBW bandwidth, and QP detector, if available.
Zoom in to the failing peak by setting the center frequency of the analyzer to the peak frequency of interest. Set the span to 10x the RBW specified in standard (if the specified RBW is 9 kHz, then set the span to 90 or 100 kHz), and then change the filter to EMI, the detector to QP, and RBW to 9 kHz. And observe the scan.
Scans performed using the QP detector will take much longer to perform due to the nature of this detector. QP scans will never exceed scans with a Positive Peak detector, but using the QP can limit the time spent over-engineering a solution.
3. Many spectrum analyzers have Max Hold trace types that will continuously hold the highest amplitudes of each frequency scan. You can enable a single trace as Clear Write to show active RF performance and enable a second trace as Max Hold. This allows you to compare changes in the DUT to the “worst case” data collected and “frozen” using Max Hold.
4. You can use markers and peak tables to clearly indicate peak frequencies and amplitudes, if available.
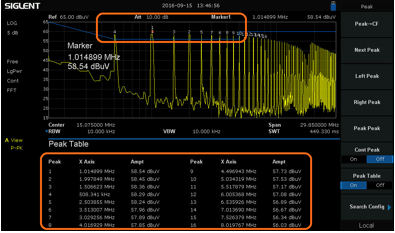
Figure 6: SSA3000X analyzer with Peak table and markers activated.
SOFTWARE
In order to ease the burden of collecting data and screenshots for your EMC reporting, SIGLENT also offers a software package called EasySpectrum. This provides a fast way to enter, store, and recall hardware correction factors, limit lines, and generate scan reports. See the SSA3000X Software page for more information.
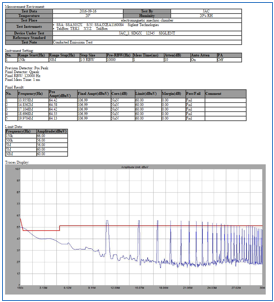
Figure 7: A sample EMI Scan report from the SIGLENT EasySpectrum Software.
CONCLUSION
Products that are primarily powered through connections to the national energy grid need to pass conducted emissions compliance tests. While companies may choose to self-certify, it is recommended to have a third-party lab perform compliance tests. But, third party labs can be expensive and scheduling time in the lab can be difficult.
With a few simple tools, you can implement an in-house pre-compliance test process that will minimize the total development time for your products, lower the cost of design, and decrease the amount of testing on future products.
For more information, check the SSA3000X webpage, or contact your local SIGLENT office.
