Quickly Monitor FM Deviation using a Spectrum Analyzer
February 22, 2018
Spectrum analyzers are very useful tools for observing radio transmissions. One of the more common applications is to monitor a known channel or band of frequencies. In this note, we are going to show how to quickly capture an FM radio transmission and then configure the analyzer to provide us with the frequency deviation of that signal.
NOTE: If you are unsure of the power of the signal that you are attempting to measure, it may be a good idea to add external attenuation to the RF input of the analyzer to help prevent damage to the analyzers sensitive measurement circuit. You are ultimately responsible for any damage caused by excessive signal power.
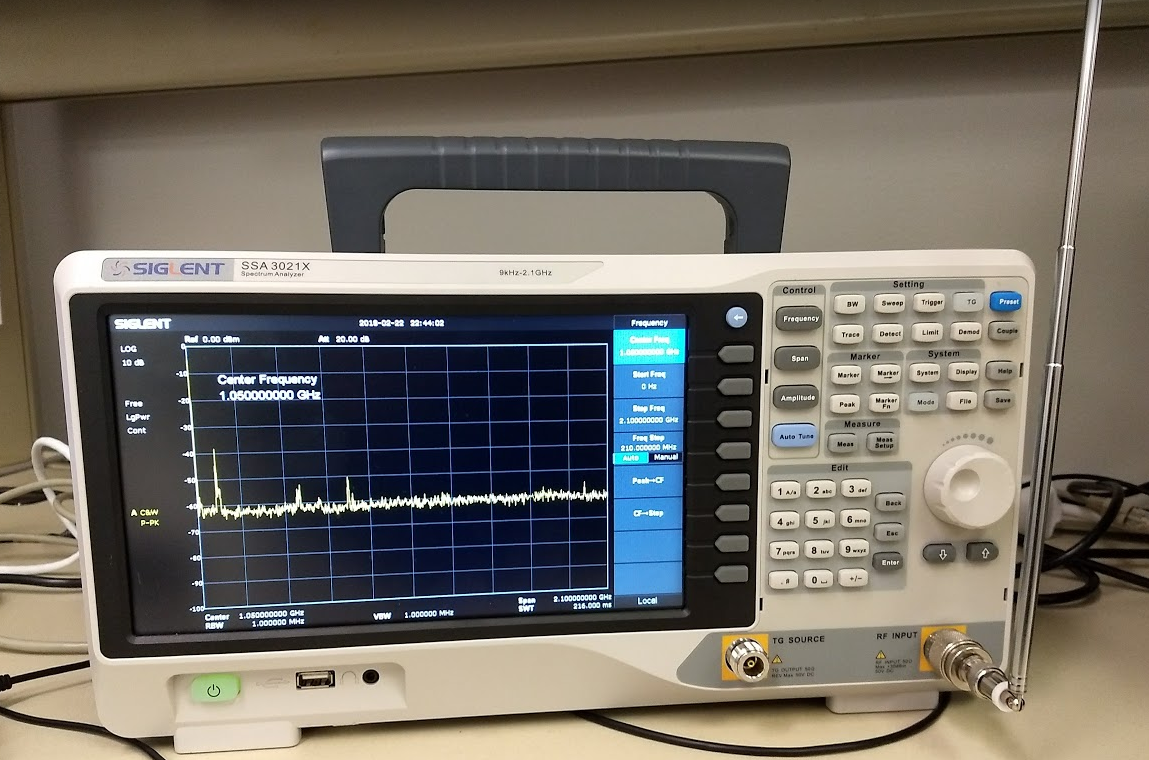
- Connect the appropriate antenna to receive the signals of interest:
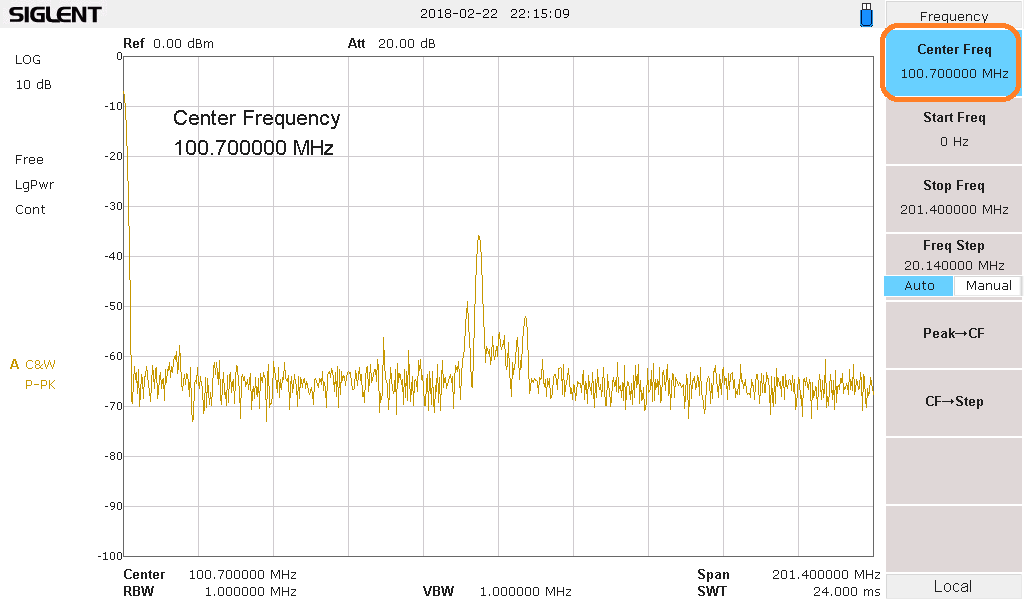
2. Press Frequency > Center Frequency and set the center frequency to match the frequency of interest. Here, we are setting the center frequency to 100.7 MHz, a local FM radio station:
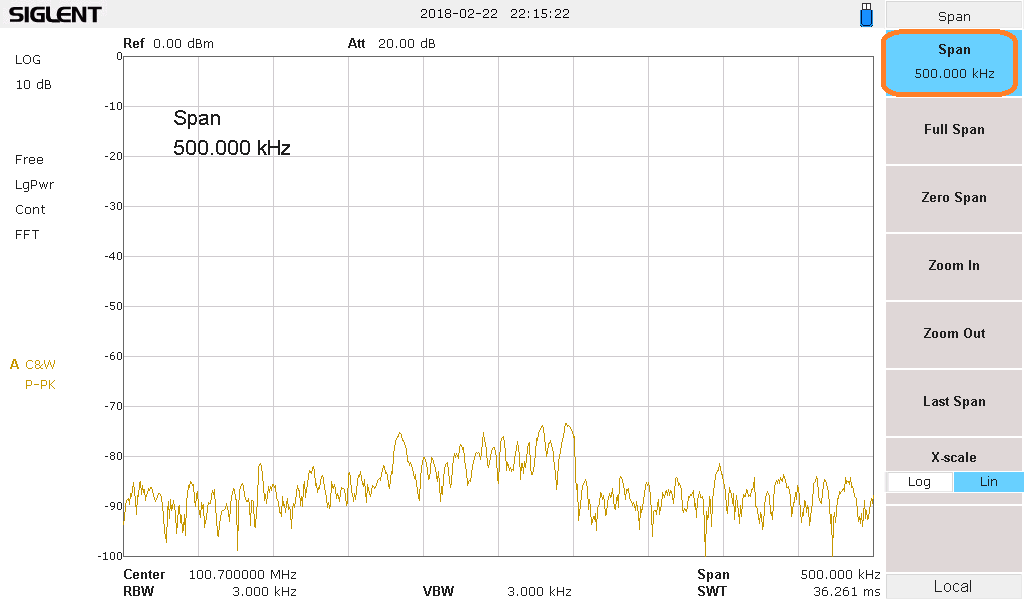
2. Press Span > Span and set the span to an appropriate level for your application. If you are looking at a single channel, you can set the span to 500 kHz or so. This will allow you to observe the channel and the full range of the frequency deviation:
3. If the signal is still very low or cannot be easily observed through the noise, you can lower the attenuation by pressing Amplitude > and lower the Attenuator setting. You can also enable the preamplifier.
NOTE: Use caution as lowering the attenuation and enabling the preamplifier makes the instrument more susceptible to damage due to overpowering the input.
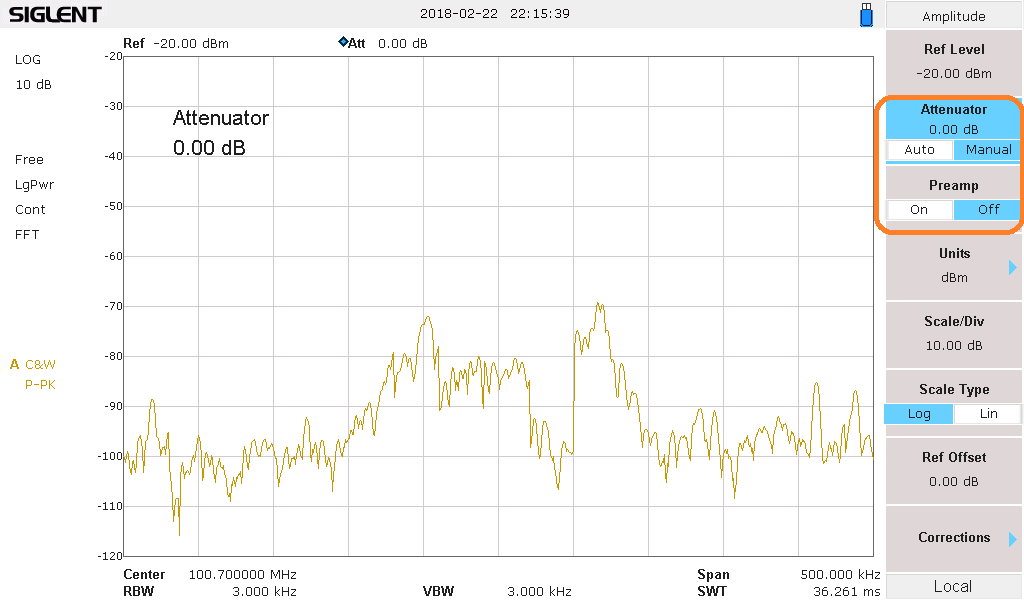
After adjusting the preamp and attenuator, you can see the signal rise out of the noise:
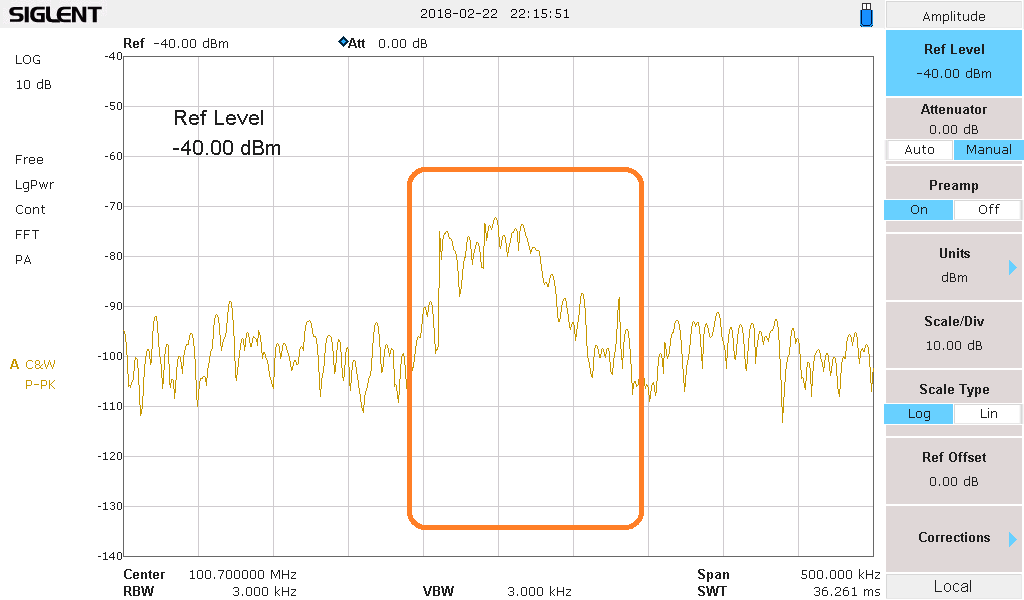
4. Now, we can activate another trace on the display and we can set it to be a Max Hold trace type. This trace type records the largest amplitude for each frequency bin and it will stay there until it has been manually cleared. Over time and successive scans, the Max Hold trace will show us the frequency deviation of our signal.
Note that trace 1 type is Clear Write. This overwrites each frequency bin amplitude with a new value for each scan:
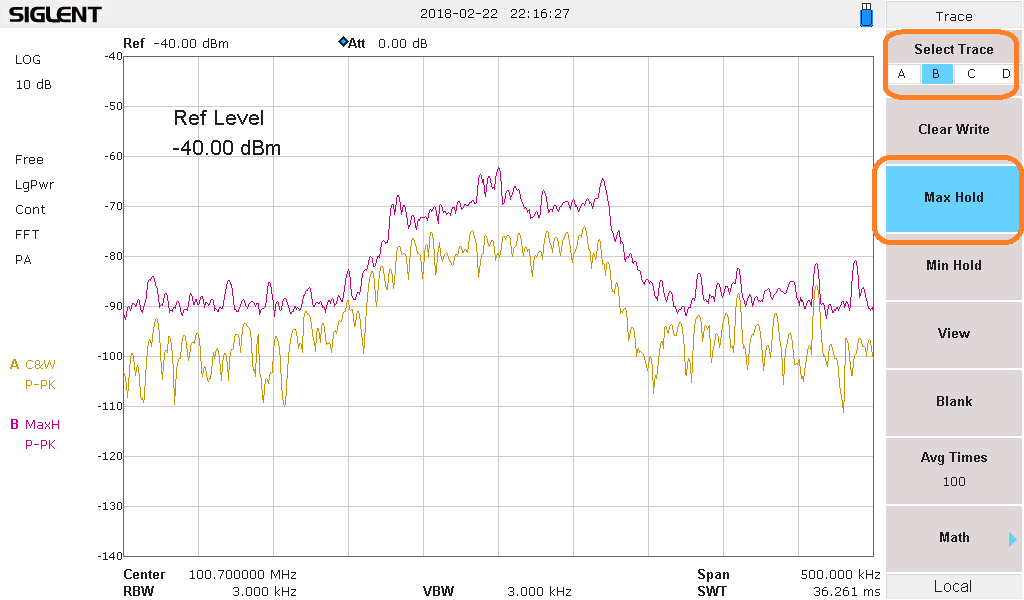
The FM deviation of this signal is approximately 4 divisions.
The Span is 500 kHz and there are 10 divisions on the display. Therefore, each division is 50 kHz. So, the FM signal deviates around 200 kHz.
You can use markers for more accurate measurements:
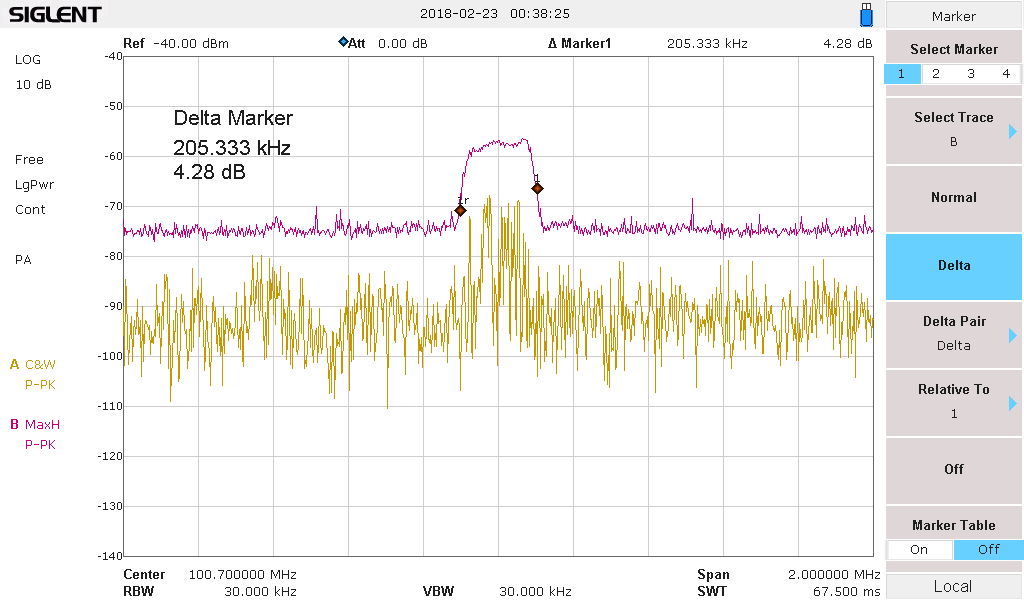
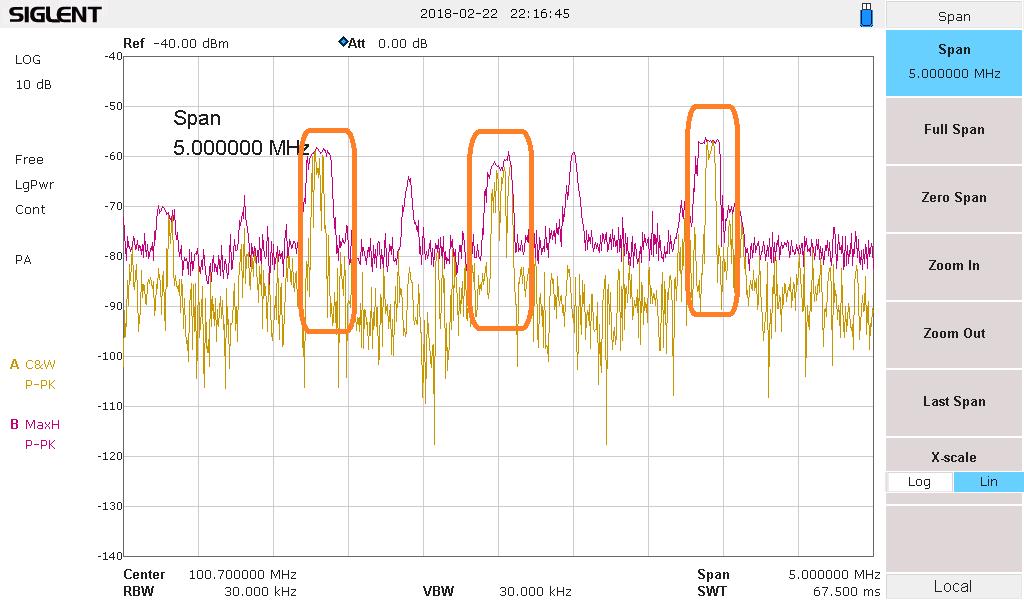
Or adjust the span to see adjacent transmissions:
